Graphs of Sine and Cosine
Easy Problem
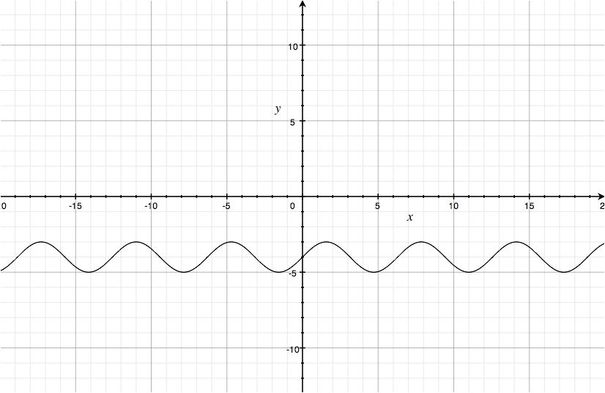
Graph the function f(x)=sinx-4
The subtraction of 4 has the effect of moving the parent function down 4 units. Notice that the graph to the left has been moved down until the sinusoidal axis is located at -4.
The subtraction of 4 has the effect of moving the parent function down 4 units. Notice that the graph to the left has been moved down until the sinusoidal axis is located at -4.
Medium Problem
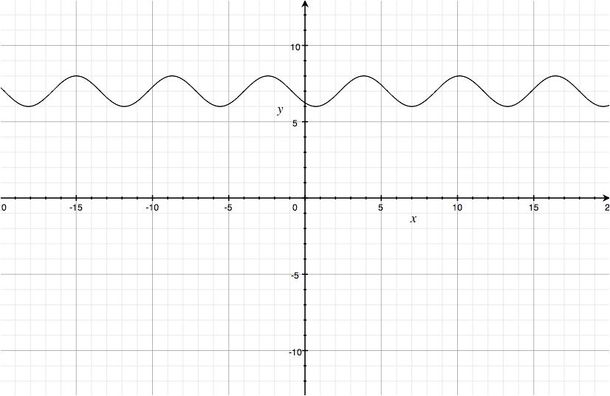
Graph the function f(x)=sin(x+4)+7
The addition of 4 in the inside of the parenthesis moves the graph 4 units to the left.
The addition of 7 outside the parenthesis moves the graph up 7 units, making the sinusoidal axis at 7 instead of at 0.
The addition of 4 in the inside of the parenthesis moves the graph 4 units to the left.
The addition of 7 outside the parenthesis moves the graph up 7 units, making the sinusoidal axis at 7 instead of at 0.
Challenge Problem
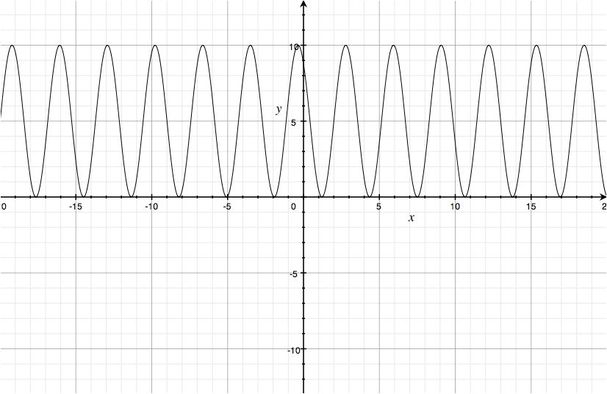
Graph the function f(x)=5sin2(x-2)+5
First, lets start with the 2 in front of the parenthesis. To find the period of a sine graph, take the B value, which is 2, and divide 2π by it. Therefore, the period of this graph is just π.
Next, lets take the 5 from the front. This 5 increases the amplitude of the graph to 5, instead of 1. Notice how the graph goes from a maximum of 10 (5 above the sinusoidal axis) to a minimum of 0 (5 below the sinusoidal axis).
Lastly, the 2 subtracted from inside the parenthesis moves the graph to the right 2 units. And the addition of 5 outside the parenthesis moves the graph up 5 units, putting the sinusoidal axis at 5.
Real-World Example
Now that you know how to graph the sine function, try this real-world problem all by your self.
A dolphin follows the equation f(x)=3sin(x-2) after passing a certain point. Graph 2 periods of the dolphin's path above and under the water.
A dolphin follows the equation f(x)=3sin(x-2) after passing a certain point. Graph 2 periods of the dolphin's path above and under the water.
